Analytics Dashboard
The analytics dashboard provides real-time, actionable insights into your workspace’s calls and agent performance. The dashboard makes it easy to monitor key metrics, identify trends, and optimize team productivity. For advanced users, you can export analytics data via API for integration with your BI tools or custom dashboards.
The dashboard updates every hour.
The dashboard helps you:
- Eliminate manual tracking and reporting
- Have a clear, instant view of AI agents’ performance
- Facilite data-driven decisions and process improvements.
Use the analytics dashboard
To access the analytics dashboard, click Analytics on the left-hand sidebar.
1. Filter data
- Use the top filters to select:
- Inbound/Outbound calls
- All Assistants or a specific assistant
- Monthly/Weekly/Custom time ranges
- All Agents or specific agents.
2. Review key metrics and visualizations
- Executed actions: Select an action to see its occurrence over time.
- Sentiment: Track the percentage of positive interactions and changes over time.
- Assistant performance: Compare assistants by minutes used, calls handled, or success rate.
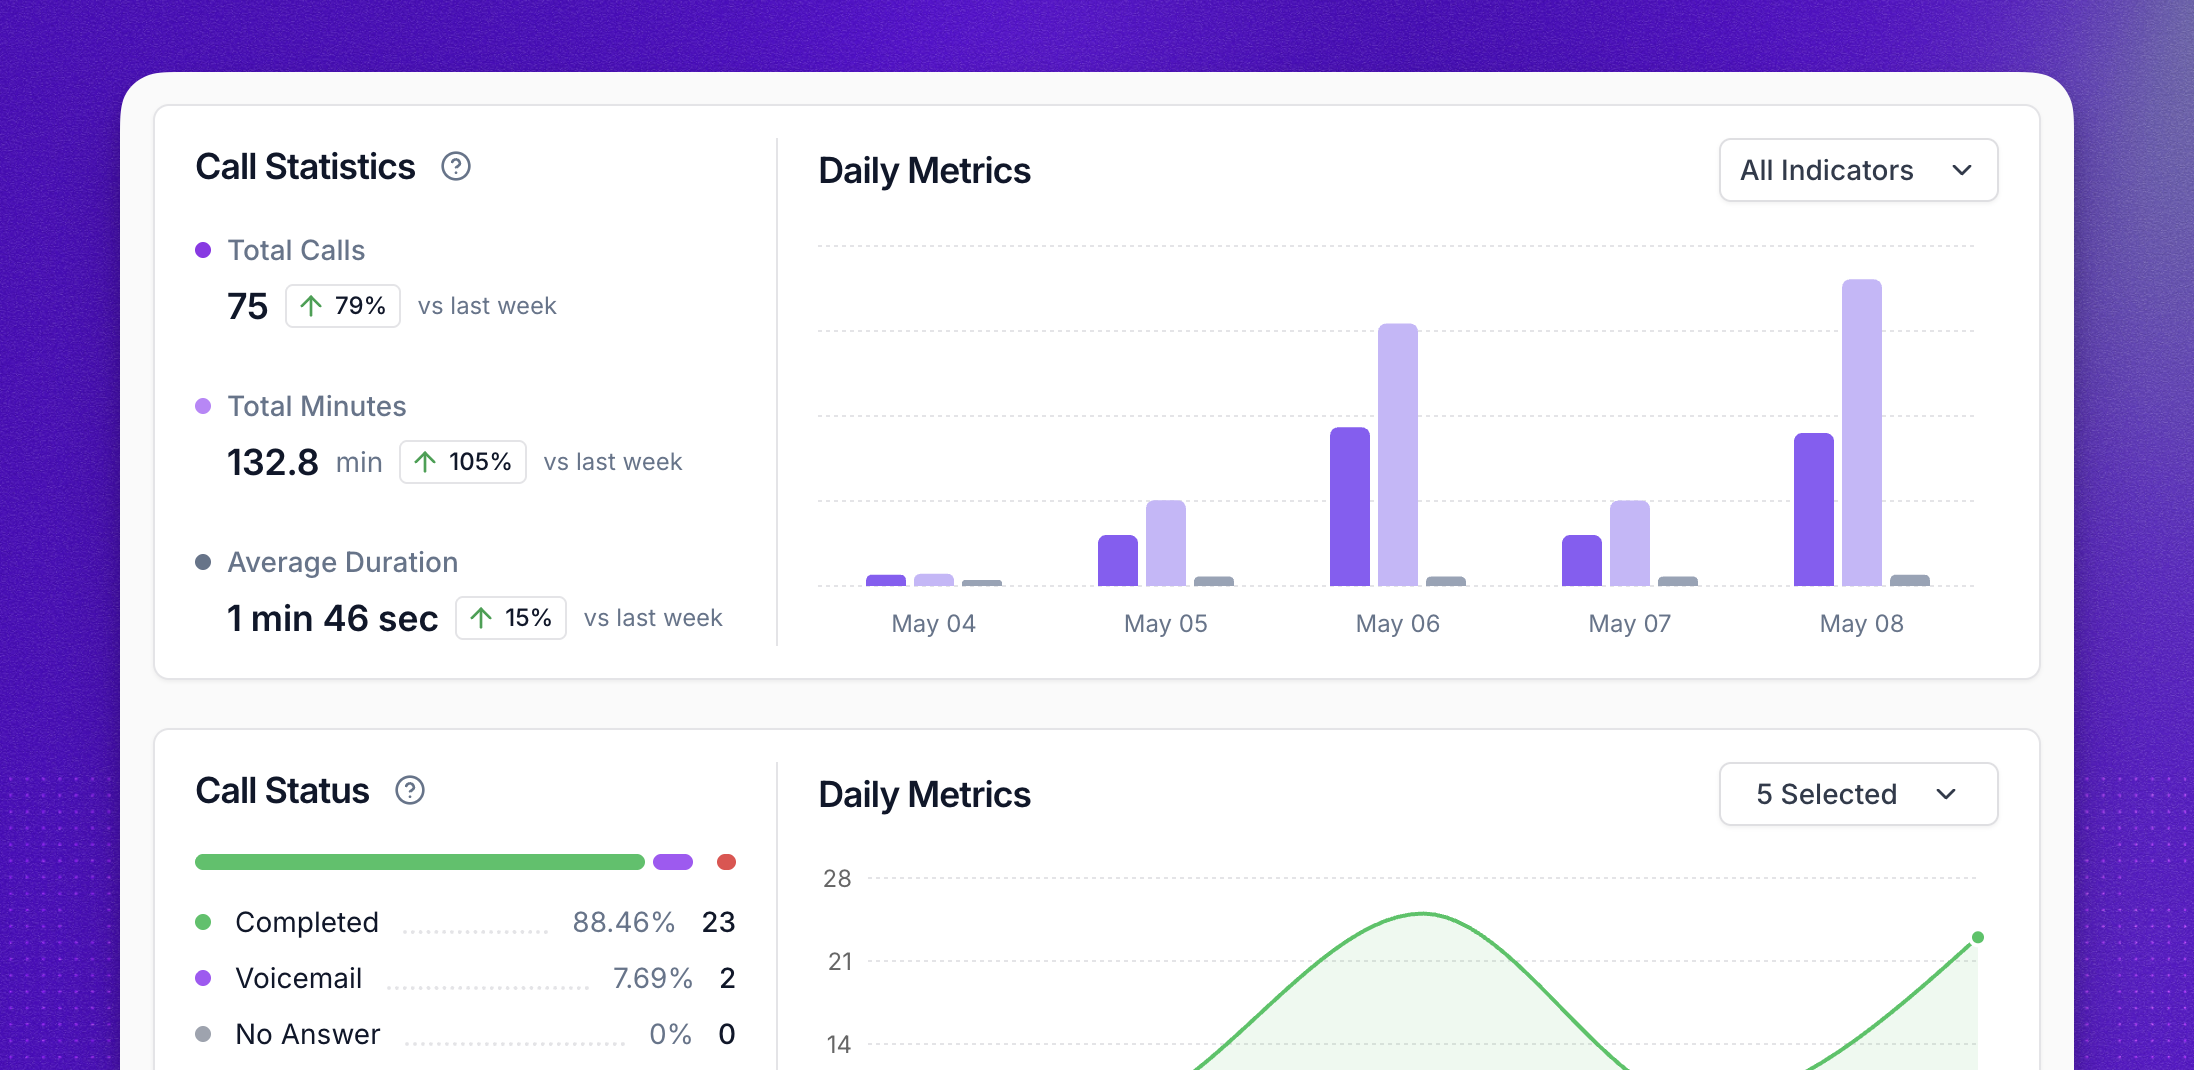
3. Analyze call statuses
- Call status over time: Visualize completed, voicemail, left voicemail, failed, and no answer statuses with trend lines.
- Call status overview: View aggregate stats for each call status type.
4. Explore deep-dive metrics
- Duration metrics: Track total calls, total minutes, and average duration over your selected time range.
- Reasons behind ended calls: Understand why calls ended (e.g., Address Incomplete, Voicemail, Forbidden).
- Failed calls: Review details for calls that failed, including contact, date, status, duration, and agent.
5. Export analytics data
- Use the Export button to download a CSV of the analytics data shown.
- For automated or custom exports, use the API endpoint.
Use cases
- Monitoring inbound and outbound call volumes and trends.
- Measuring agent performance over time.
- Tracking the outcomes and statuses of calls (e.g., completed, voicemail, left voicemail, failed, no answer).
- Exporting analytics for further analysis in Power BI, Tableau, Google Data Studio, or custom dashboards.
Tips and best practices
- Use filters to zoom in on specific assistants, agents, or time periods.
- Review sentiment and end-call reasons regularly for quality improvements.
- Keep date ranges under 120 days for successful API requests.
Troubleshooting
- If your analytics data isn’t updating, refresh the dashboard page and double-check your filters.
- If the file you’re exporting is empty, make your filters less strict and check if there is any recent activity that was not included.