Logs
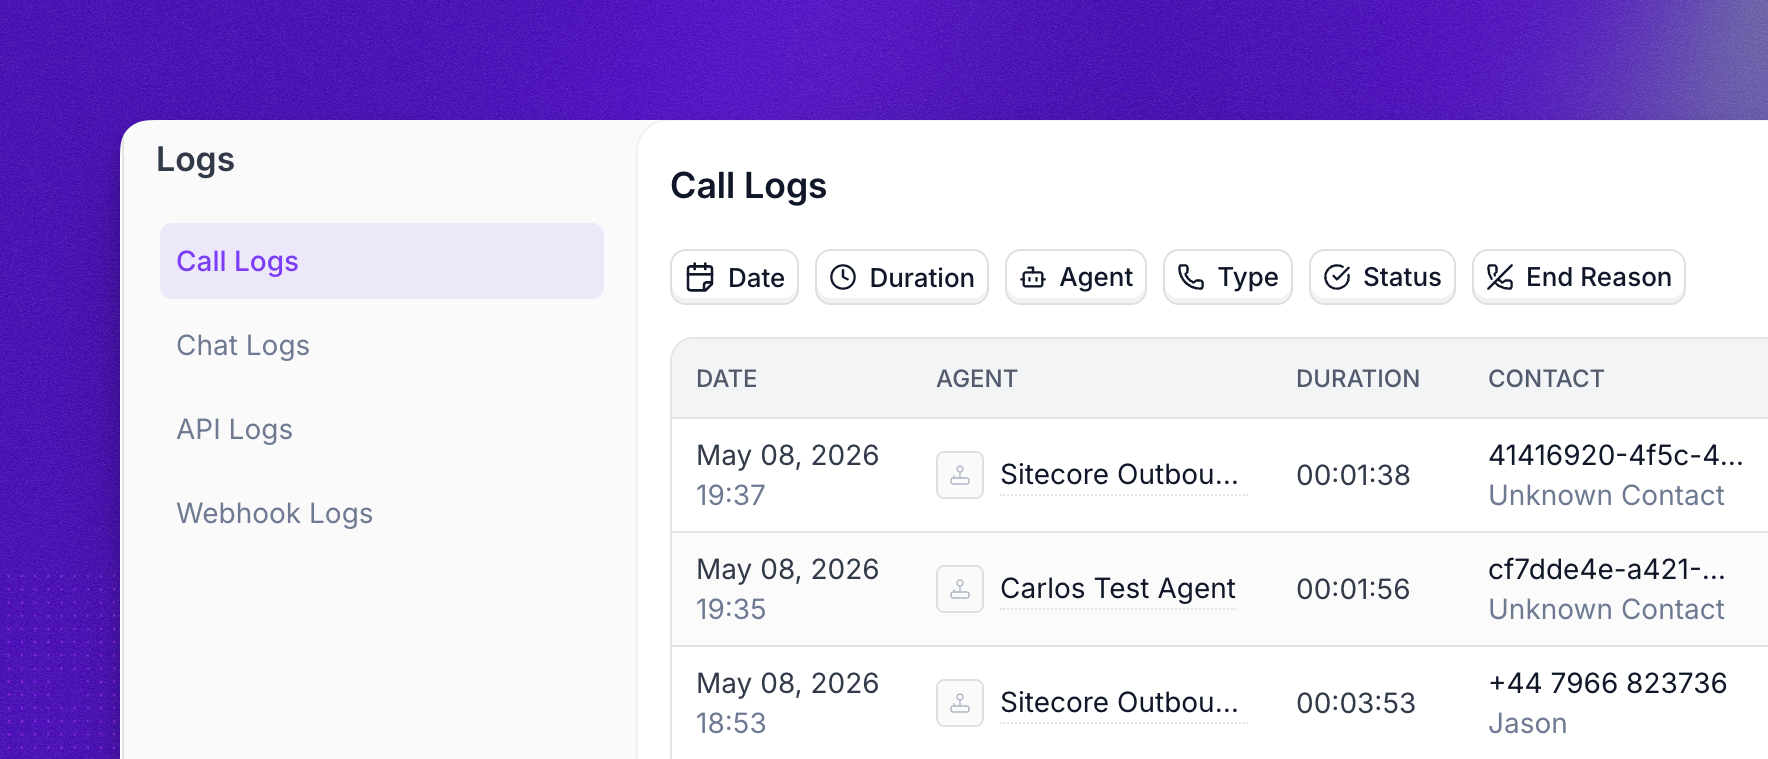
Synthflow provides a unified logging system that gives you complete visibility into all your agent operations. Open the Logs page in your Synthflow dashboard to access four log types in one centralized place:
- Call logs: Complete call history with transcripts and metadata
- Chat logs: Conversation history for chat agents across API, widget, WhatsApp, and SMS
- API logs: Audit trail of all API requests triggered by your agents
- Webhook logs: Webhook interactions and delivery status
Call logs
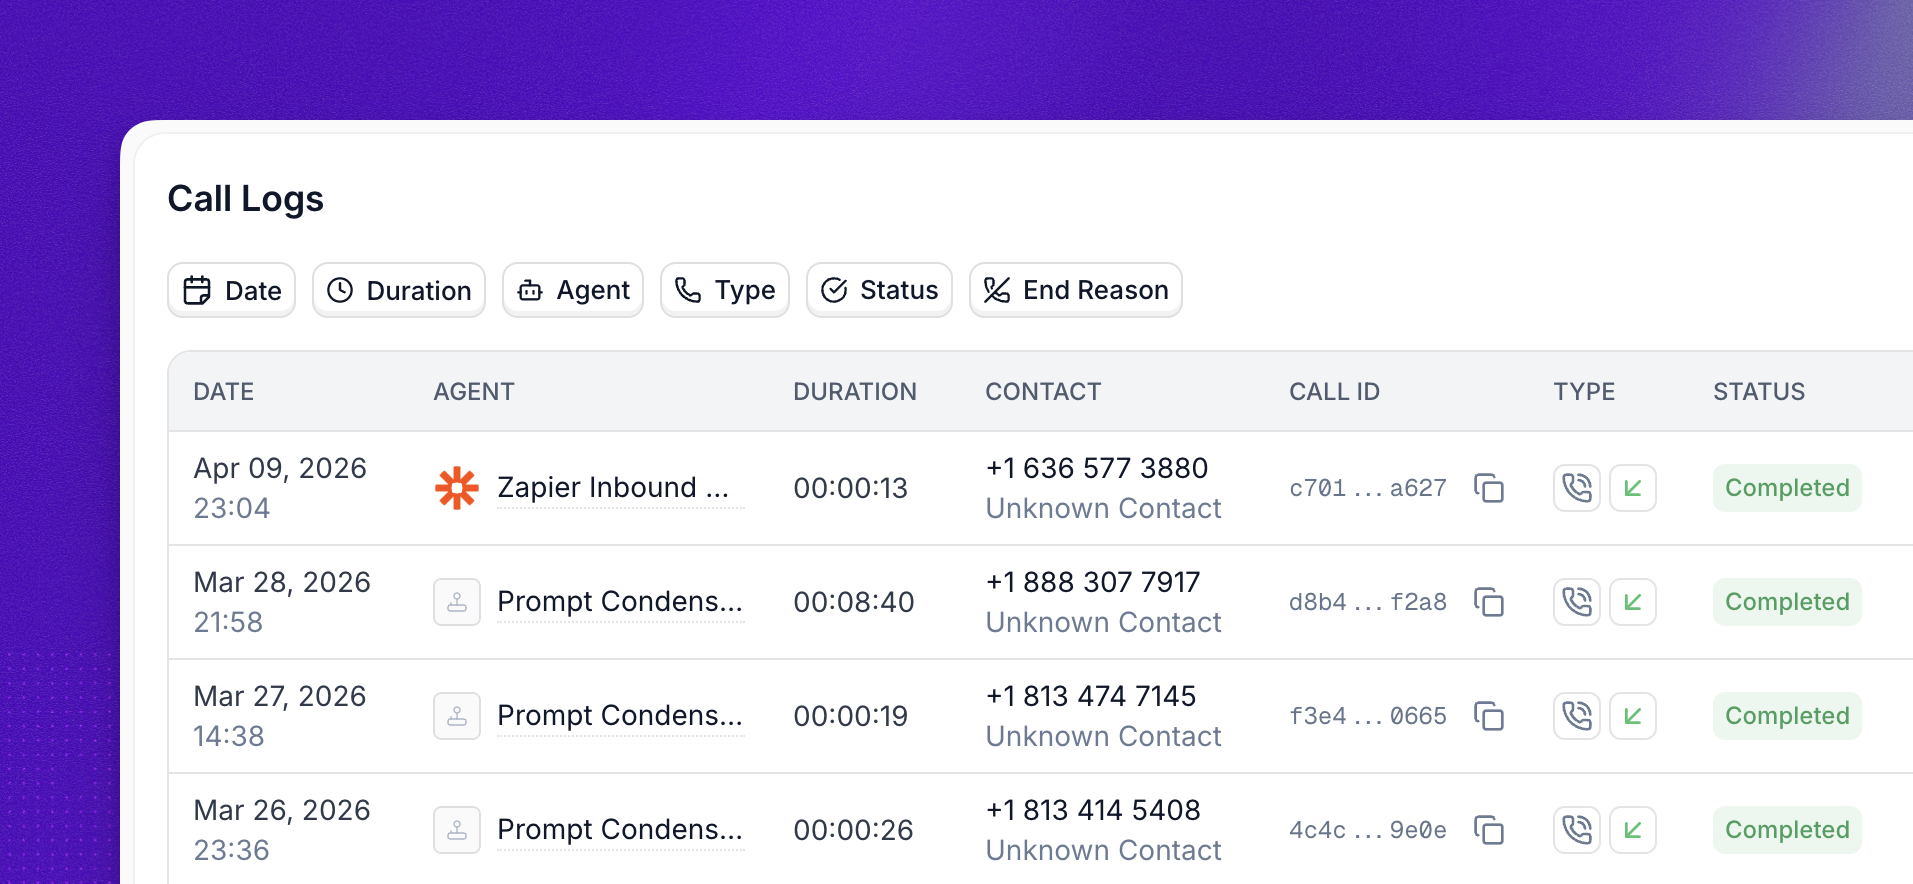
Call logs give you full visibility into every call your agents handle. Beyond the dashboard, you can export call logs to CSV for reporting or consume the same data programmatically through the post-call webhook, which also documents the full list of statuses and end-call reasons.
Click on any call log to view detailed information in the call details drawer, organized into four tabs:
Overview
Transcript
Actions
Telephony
The Overview page shows the call’s status, timing, and agent-related information:
- Status: The call’s current state or outcome (e.g. Completed, Failed, No Answer)
- Deployment: Channel that handled the call (e.g. Telephony)
- Telephony Type: Specific entry point used (e.g. Phone, Widget, Web Call)
- End call reason: Why the call ended, when applicable
- Date: Date the call occurred
- Started: Timestamp when the call began
- Ended: Timestamp when the call ended
- Duration: Total call duration
- Agent: Name of the agent that handled the call
- Agent ID: Unique identifier of the agent
- Agent Version: Version of the agent configuration used
- Contact: Contact identifier or number
- Contact Name: Resolved name for the contact (or
Unknown Contact) - Labels: Any custom labels assigned to the call
The Duration shown in the call log reflects the total call duration, which includes all phases of the call such as PBX delay, ringing time, and conversation time. The Recording, however, only captures the conversation portion of the call. This means the recording duration will often be shorter than the total duration displayed in the log.
For example, a call with a logged duration of 18 seconds may include a PBX delay (e.g., ~4 seconds), ringing (e.g., ~7 seconds), and actual conversation (e.g., ~7 seconds). In this case, the recording would only be 7 seconds long since it starts when the conversation begins.
Live call monitoring

While a call is in progress, you can listen in to the live conversation as it happens. Monitoring is silent: neither the agent nor the caller can hear you, so you can observe without affecting the call. Live monitoring is available only while the call’s status is in-progress. Once the call leaves that state, review the recording and transcript from the call details drawer instead.
Open the Logs page, find the call with the in-progress status, and select Listen in to start monitoring.
Chat logs
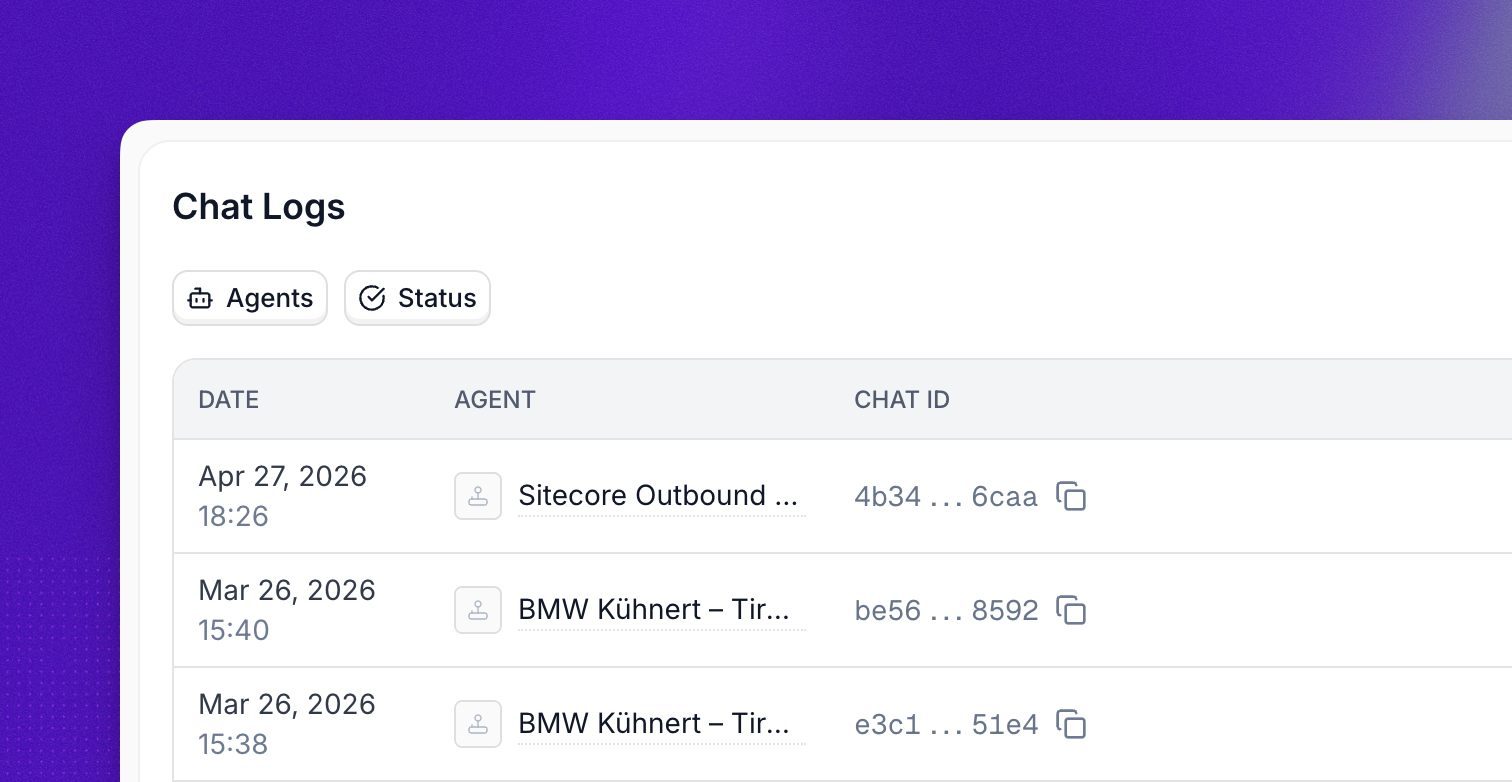
Chat logs give you full visibility into every chat conversation your agents handle. Conversations are recorded when end users interact with a chat agent over API, widget, WhatsApp, or SMS, and when you test an agent with chat from the agent editor. You can also consume the same data programmatically through the post-conversation webhook.
Click on any chat log to view detailed information in the chat details drawer, organized into three tabs:
Overview
Transcript
Actions
The Overview page shows the chat’s status, timing, and agent-related information:
- Status: The chat’s current state (e.g.
In Progress,Completed) - End reason: Why the conversation ended, when applicable (e.g.
completed,inactivity_timeout) - Date: Date the conversation started
- Started: Timestamp when the first message was sent
- Ended: Timestamp when the conversation ended
- Duration: Total elapsed time
- Agent: Name of the chat agent that handled the conversation
- Agent ID: Unique identifier of the agent
- Agent Version: Version of the agent configuration used
API logs
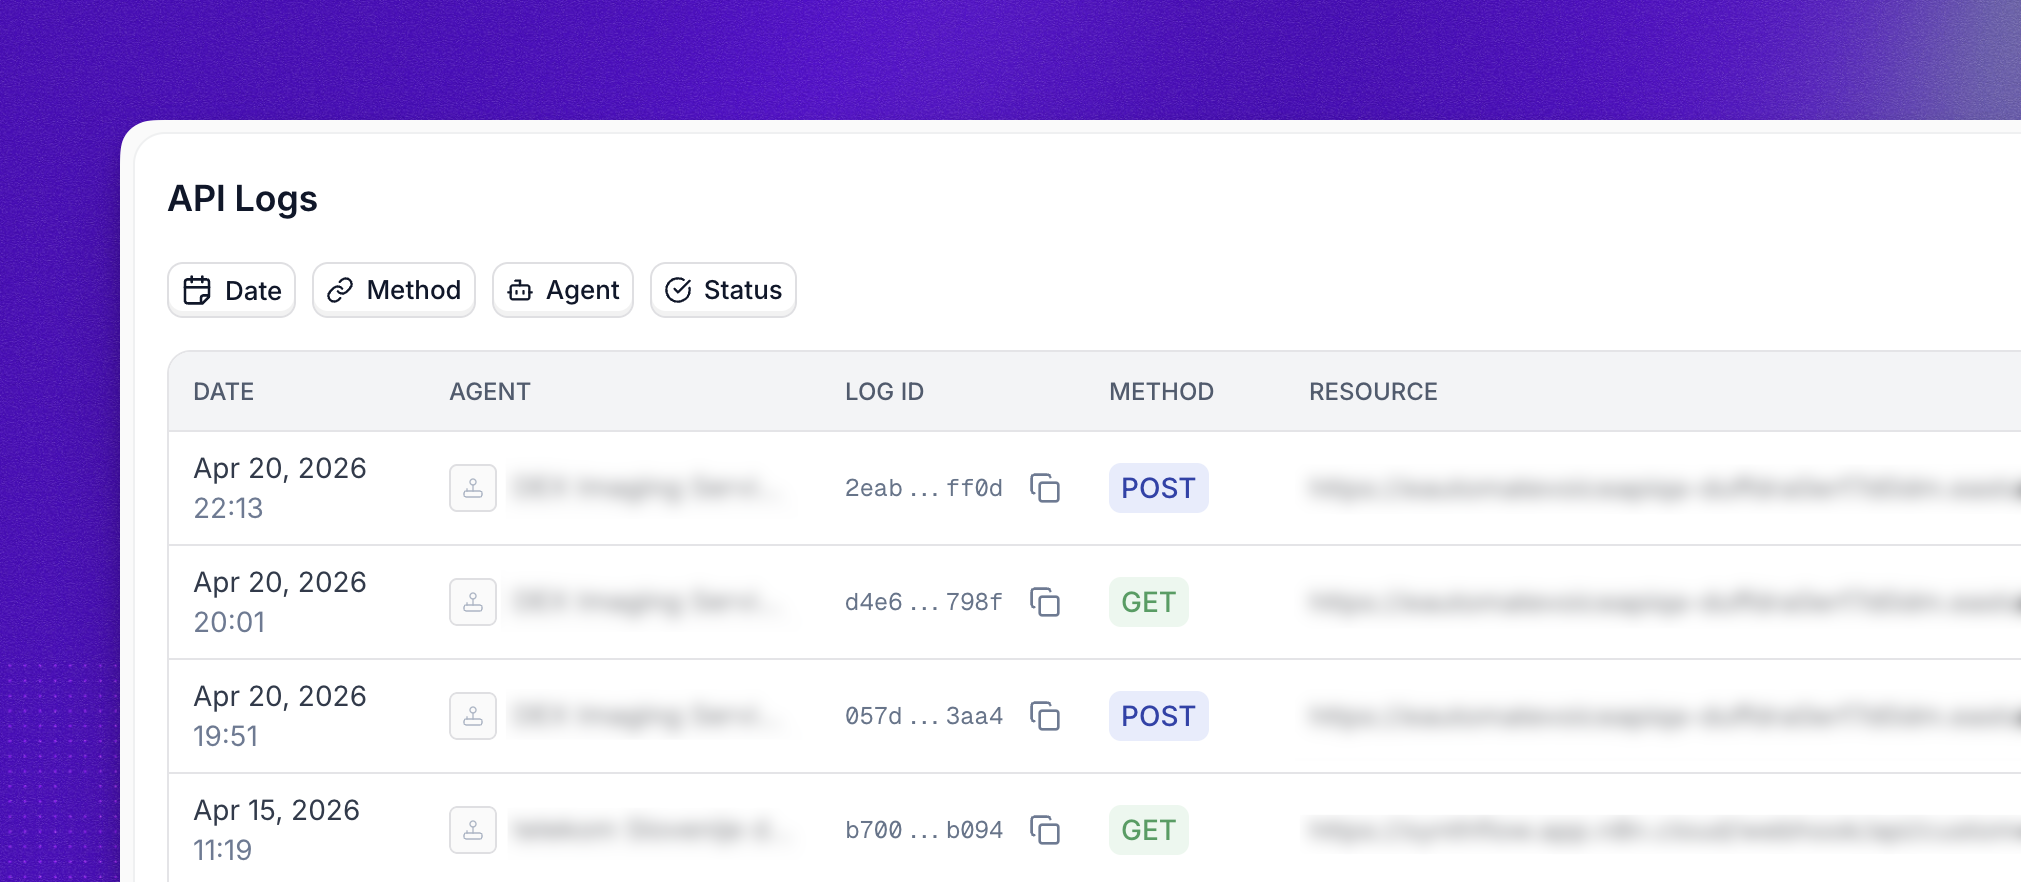
API logs track every outbound API request your agents make during calls and chats, including custom actions and other integrations. Each entry links back to the Call logs entry that triggered it.
Click on any API log to inspect the request and response, organized into two tabs:
Request
Response
The Details block shows the agent and call context behind the request:
- Agent: Name of the agent that triggered the request
- Agent ID: Unique identifier of the agent
- Agent Version: Version of the agent configuration used
- Trace ID: Correlation ID used to connect related logs across services. Share it with support when investigating issues.
- Call ID: Identifier of the phone call or session that triggered the request. Use it to jump to the matching entry in Call logs.
- Date: Date the request was made
- Started: Timestamp when the request was issued
- Finished: Timestamp when the response was received
- Time During Call: Time elapsed in the call when the request fired
Webhook logs
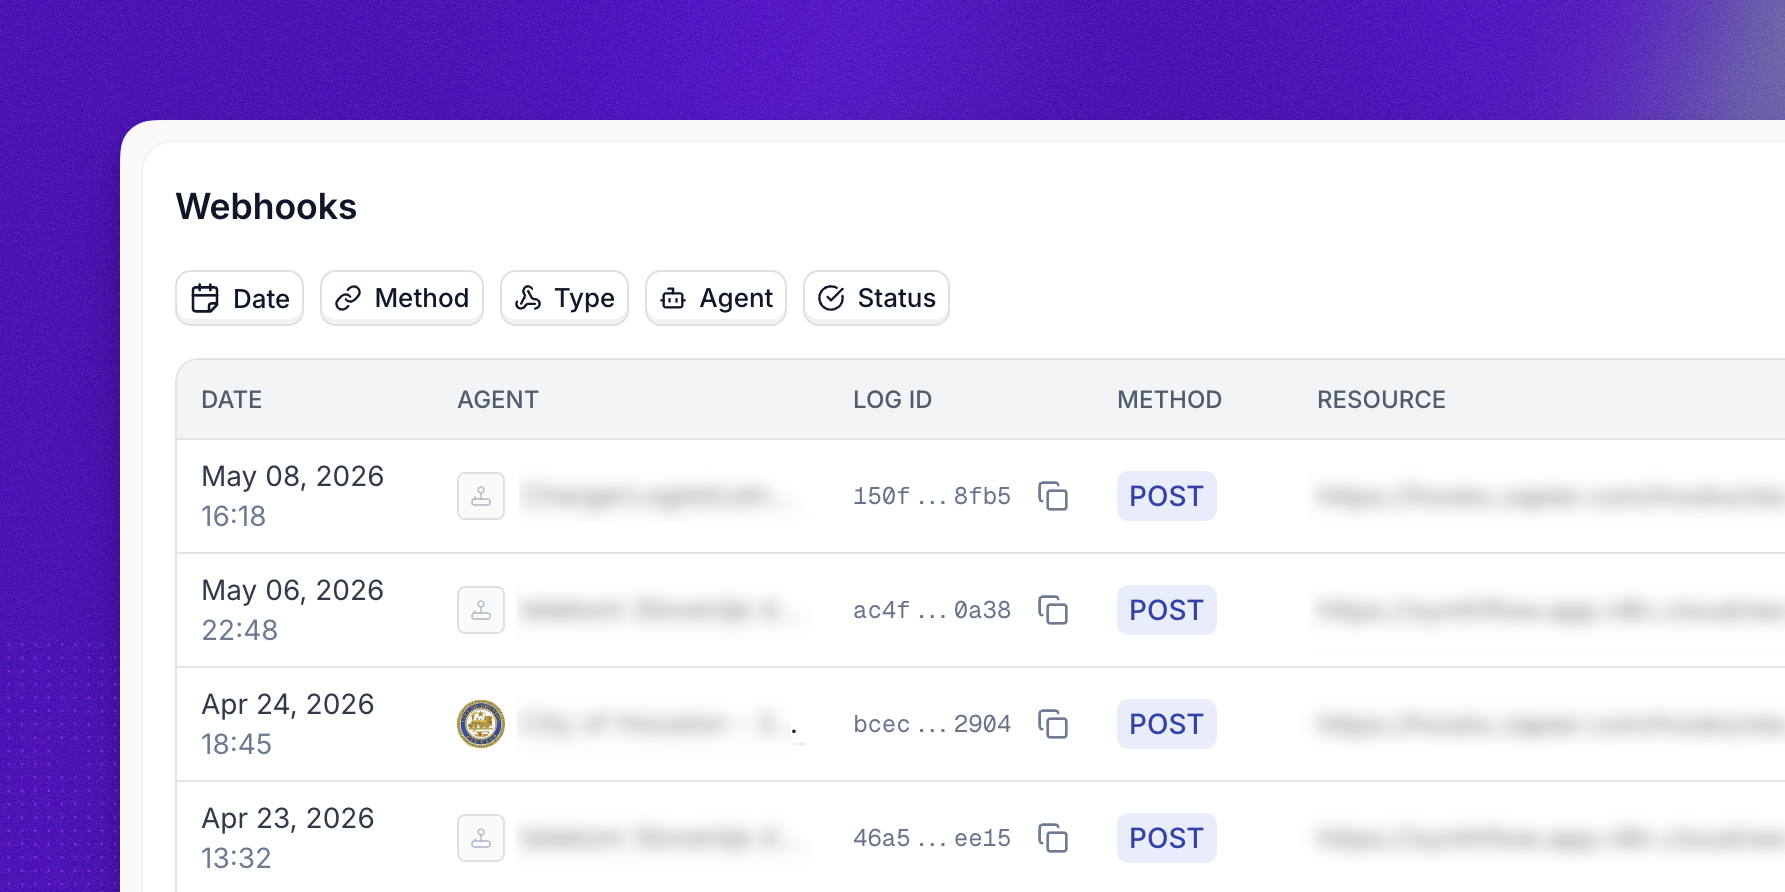
Webhook logs track every webhook delivery to and from your workspace, including inbound webhooks, post-call webhooks, and custom integrations. For payload shapes and setup, see Webhooks. Each entry links back to the Call logs entry that triggered it. Click on any webhook log to inspect the request and response, organized into two tabs:
Request
Response
The Details block shows the agent, call context, and webhook category:
- Agent: Name of the agent that triggered the webhook
- Agent ID: Unique identifier of the agent
- Agent Version: Version of the agent configuration used
- Trace ID: Correlation ID used to connect related logs across services. Share it with support when investigating issues.
- Call ID: Identifier of the phone call or session that triggered the webhook. Use it to jump to the matching entry in Call logs.
- Type: Webhook category (e.g.
External,Inbound,Custom Action) - Date: Date the webhook was triggered
- Started: Timestamp when the request was issued
- Finished: Timestamp when the response was received
- Duration: Total time the webhook took to complete
Best practices
- Always filter by date range when querying logs. Large log volumes are slower to load without a time filter.
- Search by identifier (Call ID, Action ID, Agent name) rather than freeform keywords for faster, more accurate results.
- Export in chunks by applying filters and date ranges before exporting, and run exports regularly if you need to keep records beyond your plan’s retention window.
- Review API and webhook logs proactively for failed requests, unusual response times, recurring error patterns, and webhook delivery failures that may indicate endpoint or integration issues.
API access
Call, API, and webhook logs are also available programmatically. See the API reference for the full set of endpoints and parameters. Chat logs are not yet available via the API.
FAQ
Where do I find logs for a specific agent?
From the Logs page, use the Agents filter to scope every log type (calls, chats, API, webhook) to a specific agent.
Why is the recording shorter than the call duration?
The Duration field includes PBX delay, ringing, and conversation time, while the recording only captures the conversation portion. A logged duration of 18 seconds can correspond to a 7-second recording if there were 4 seconds of PBX delay and 7 seconds of ringing.
Can I listen to a call while it is happening?
Yes. While a call’s status is in-progress, open it from Call logs and select Listen in to monitor the live conversation. Monitoring is silent, so neither the agent nor the caller can hear you. Once the call ends, review the recording and transcript from the call details drawer instead.
How do I trace a custom action that failed during a call?
How long are logs retained?
Retention depends on your plan. Export logs regularly using the Export button (call logs) or the API reference if you need historical records beyond your plan’s retention window.